Application Performance Monitoring (APM) has gone beyond the realm of operation professionals, such as IT and system engineers. Developers need APM, as well. But not every tool included in your average APM is necessary for your code. So, as a developer, what are the best APM tools you should be using?
Here are three tools we believe are essentials for developers:
- Apdex Tool
- Error rate
- HTTP information
These three tools are guaranteed to improve your code and application’s performance. Let’s take a closer look.
Three APM Tools Developers Need
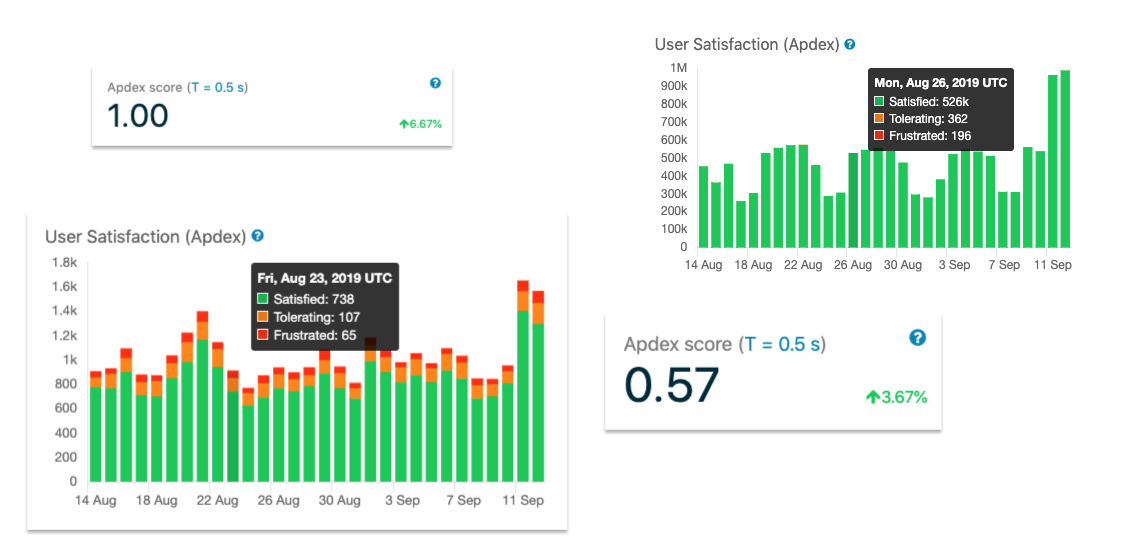
Apdex Score
If you’re not familiar with Application Performance Monitoring in general, you might not be familiar with an Apdex Score. An Apdex Score is a unit of measurement which quantifies the user experience (UX). Its measurement is based on five variables: T, Satisfied Count, Tolerating Count, Frustrated Count, and Total Samples.
The formula appears as so:
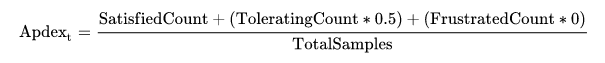
Image Source: https://en.wikipedia.org/wiki/Apdex
When all of your variables are placed into the following formula, you’ll come up with a number between 0 and 1. The closer your score is to 1, the better your user experience.
What the heck does this have to do with coding?
Your Apdex Score can tell you when something is seriously wrong with your application.
Imagine: you deploy a new batch of code and your Apdex Score tanks. Your poor user experience is most likely related to that new deployment. As a developer, you can easily find the point where your Apdex Score fell and fix the error causing it.
When looking for potential APMs for your application, make sure to invest in one with an Apdex Score tool.
Error Rate
Wait, what if I already have an error monitoring software? Why would Error Rate be an important metric to me as a developer? Great question!
Application Performance Monitoring is excellent when it comes to giving you a general idea of what’s going on with your application. Error monitoring is great for deep-dives into your code so you can find and fix errors quickly.
For Airbrake specifically, Error Rate perfectly enriches our Error Monitoring software because it tells you immediately if there's an increase in errors and how those errors may be impacting your application and its users. That’s what Airbrake APM is all about: immediate, real-time, information about your application.
HTTP Information
Consider this: a one-second delay in app response time can result in a 16% decrease in customer satisfaction. This is why it's important that your app runs quickly and is optimized to prevent slowdowns. The problem is that you might not know you were experiencing a slowdown based on looking at your code alone. This is where APM and HTTP monitoring comes in.
You know how HTTP works, but how does it work in the context of application health? Typically, HTTP issues tend to be dealt with by IT and other operation professionals. But as a developer, there’s plenty of information you can glean from HTTP relating to your code.
For example, what if your request and request rates remain the same, but your response times have significantly slowed down? At that point, you can assume it’s not the servers that need to be fixed, but something related to your code. Maybe you recently deployed new code. Do these slowdowns coincide with this new deployment? This is something performance monitoring can tell you.
And this is just one example of how monitoring HTTP information can give you invaluable information about your code.
How All Three APM Tools Work Together
Will these three APM tools fix your code? No, but they can help you consider the quality of your code within the context of your application’s health. Together, they give you a complete and quick overview of how well your application is functioning and how your code is impacting your users.
Where Can You Find APM for Developers?
You don’t have to go far to use these tools. Airbrake Application Performance Monitoring gives you access to all these tools and gives you data about your code, production environment, and user experience; as well as:
- Contextual Drill Downs
- A Streamlined UI
- Performance Data
The best part? Airbrake APM is automatically part of every Error Monitoring Plan. So if you’re already on an Airbrake plan, you already have APM. All you have to do is to click on the Performance tab. Airbrake plans include 50K free performance events each billing cycle and can currently be used with Rails, Node.js (Express.js), Go, Django, and Flask projects.